

Abstract
BCR-ABL1 negative myeloproliferative neoplasms not only include atypical chronic myeloid leukemia (aCML), but also chronic myelomonocytic leukemia (CMML), chronic neutrophilic leukemia (CNL), and myelodysplastic/myeloproliferative neoplasm, unclassifiable (MDS/MPN, U). Despite the recent advances in characterizing aCML more specifically, based on next generation sequencing data, the differential diagnosis and subsequent treatment decisions remain difficult.
Therefore, we analyzed the transcriptome and performed whole genome sequencing (WGS) in a cohort of morphologically defined 231 patients (pts): 49 aCML, 30 CNL, 50 MDS/MPN, U, and 102 CMML all diagnosed according to WHO classification.
WGS libraries were prepared with the TruSeq PCR free library prep kit and sequenced on a NovaSeq 6000 or HiSeqX instrument with 100x coverage (Illumina, San Diego, CA). The Illumina tumor/unmatched normal workflow was used for variant calling. To remove potential germline variants, each variant was queried against the gnomAD database, variants with global population frequencies >1% where excluded. For transcriptome analysis total RNA was sequenced on the NovaSeq 6000 with a median of 50 mio. reads per sample. The obtained estimated gene counts were normalized and the resulting log2 counts per million (CPMs) were used as a proxy of gene expression.
Unsupervised exploratory analysis techniques, such as principal component analysis (PCA) and hierarchical clustering (HC) were used to identify groups of samples with similar expression profiles. We observed a high similarity between the different entities with CMML being the most distant entity, followed by CNL. MDS/MPN, U and aCML were the most similar entities. Due to high within-group heterogeneity, we found that it was impossible to identify a gene expression signature that separated aCMLs reliably from the other MDS/MPN overlap entities.
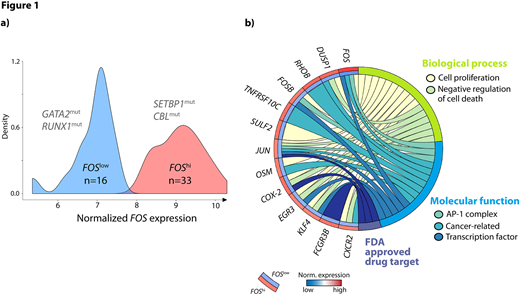
Surprisingly, PCA as well as HC indicated the existence of two subgroups within the aCMLs. Therefore, we searched for genes with a bimodal-like expression profile. We found that FOS expression levels strongly separated aCMLs into two groups of 16 pts (FOSlow) and 33 pts (FOShi), respectively. Interestingly, FOShi correlated with mutations in SETBP1 (12/33, 36% vs. 3/16, 19%), a known marker typically mutated in aCML (Figure 1a).
Addressing the mutational landscape of these two groups (FOShivs.FOSlow) we found that ASXL1 (88% vs. 100%), TET2 (33% vs. 50%), SRSF2 (45% vs. 56%), EZH2 (27% vs. 31%), and NRAS (21% vs. 25%) showed rather similar mutation frequencies. GATA2 (15% vs. 31%) and RUNX1 (18% vs. 38%) mutations were less frequent in FOShi, whereas SETBP1 and CBL (18% vs. 6%) were more frequent in this group. Consistent with known features of SETBP1 mutation this group showed a higher white blood cell count (78 x109/L vs. 52 x109/L) and platelet count (158x109/L vs. 90x109/L), although none of these differences were significant.
The two groups were further analyzed for gene expression differences and we found 16 genes with synchronized upregulation within the FOShi group that were differentially expressed (FDR < 0.05, absolute logFC > 1.5) compared to FOSlow. Functional enrichment analysis linked those genes with regulation of cell proliferation (p<0.001), negative regulation of cell death (p<0.001), and the AP-1 complex (p<0.001). Those 16 genes included the transcription factors JUN, FOSB, EGR3, and KLF4, the cancer-related genes DUSP1, RHOB, OSM, TNFRSF10C, and CXCR2, and the FDA approved drug targets JUN, COX-2, and FCGR3B (Figure 1b).
JUN/FOS are the main components of the AP-1 complex, a regulator of cell life and death. The upregulation of these genes results in increased proliferation as clinically observed in aCML pts. Furthermore, for these pts a treatment with INFα might result in an anti-proliferative effect by modulation of FOS transcript levels. Further, COX-2 inhibitors might also suppress proliferation and differentiation of leukemia cells. However, for the FOSlow pts these treatments might not be as effective due to the already low expression levels of the respective genes.
Since the expression levels of FOShi equal those of MDS/MPN overlap, whereas FOSlow levels are closer to the ones of a healthy control cohort, SETBP1 mutation might be a marker and indicator for pts with high FOS expression and therefore providing further treatment options by targeting specifically the FOS mediated pathways.
Meggendorfer:MLL Munich Leukemia Laboratory: Employment. Walter:MLL Munich Leukemia Laboratory: Employment. Hutter:MLL Munich Leukemia Laboratory: Employment. Kern:MLL Munich Leukemia Laboratory: Employment, Equity Ownership. Haferlach:MLL Munich Leukemia Laboratory: Employment, Equity Ownership. Haferlach:MLL Munich Leukemia Laboratory: Employment, Equity Ownership.

This feature is available to Subscribers Only
Sign In or Create an Account Close Modal